There are three stages of this activity aimed to hit the requirements in GSUSA Cadette, Senior, and Ambassador level App Development.
Stage 1 – Choose It
Scout choose a habit to track and analyze. Measurable habits are things that can be attached to a unit of measurement.
Time:
Choose a habit you want to change that is measured in hours or minutes per day or week. Something you want to make sure you hit a certain amount of time, or that you want to spend only a specific amount of time but are not sure how much time you really spend on it.
Ideas could be: screen time, exercise, reading for fun, video games, a special project or hobby.
Amount:
Choose a habit you want to change that is measured in units. Something you need to hit a specific amount, or that you want to limit how much is done or used.
Ideas could be: daily water intake, blood sugar levels, calories/fat/carbs eaten, number of supplies used, gold stars earned, how you feel each day
Stage 2 – Track It
Track data for at least one week. Make a system for tracking the time or amounts so it can be recorded each time you need.
- A chart to record time in minutes or hours
- A scale to rate your mood.
- A table to write what time of day your blood sugar reading was taken
- If there is a phone/tablet/computer available, it can be used as a note to record the data
- A printable sheet like this Two Week Tracker.
Hint: Set an alarm or reminder to collect data each day.
If you don’t track your data – try using the Sample Water Intake Data for the later parts of this activity.
Stage 3 – Analyze Data
Our sample data is from tracking hours of sleep. Instead of tracking our own sleep for a week, 35 students in high school were asked how many hours of sleep they got on average. Their answer was recorded as well as what grade level they were in.
See Sample of Sleep Data.
By using the GSUSA provided Blank Bar Chart, we charted their answers. Then we colored the dots to show what grade level they are. Look at the Sample of Bar Chart and decide what the data tells you. Compare your thoughts to the Study this data came from on Stat Crunch.
Take the data you charted for one week and put it in your own chart, graph, or table. After looking at your data from one week – decide what you could change to make a difference in your daily habit you tracked. If you didn’t track your data – try using the Sample Water Intake Data.
Bonus – track it again for one week to see if it made a measurable difference as you hoped.
Stage 4 – Beyond Basic Data Visualization
Stat Crunch shows the sleep data in typical bar graphs and charts. Better Sleep.org shows more sleep data in a lot of useful tables. There are a lot of ways to display data, and most of them are in the charts, graphs, and tables category.
Sisense.com shows those and then goes a step farther to show Bubble Charts and Maps that could be used (see #9-12 in their list of examples). With our Sample of Sleep Data, a Bubble Chart could show our data with more impact than the Sample of Bar Chart. (See Bubble Chart image below).
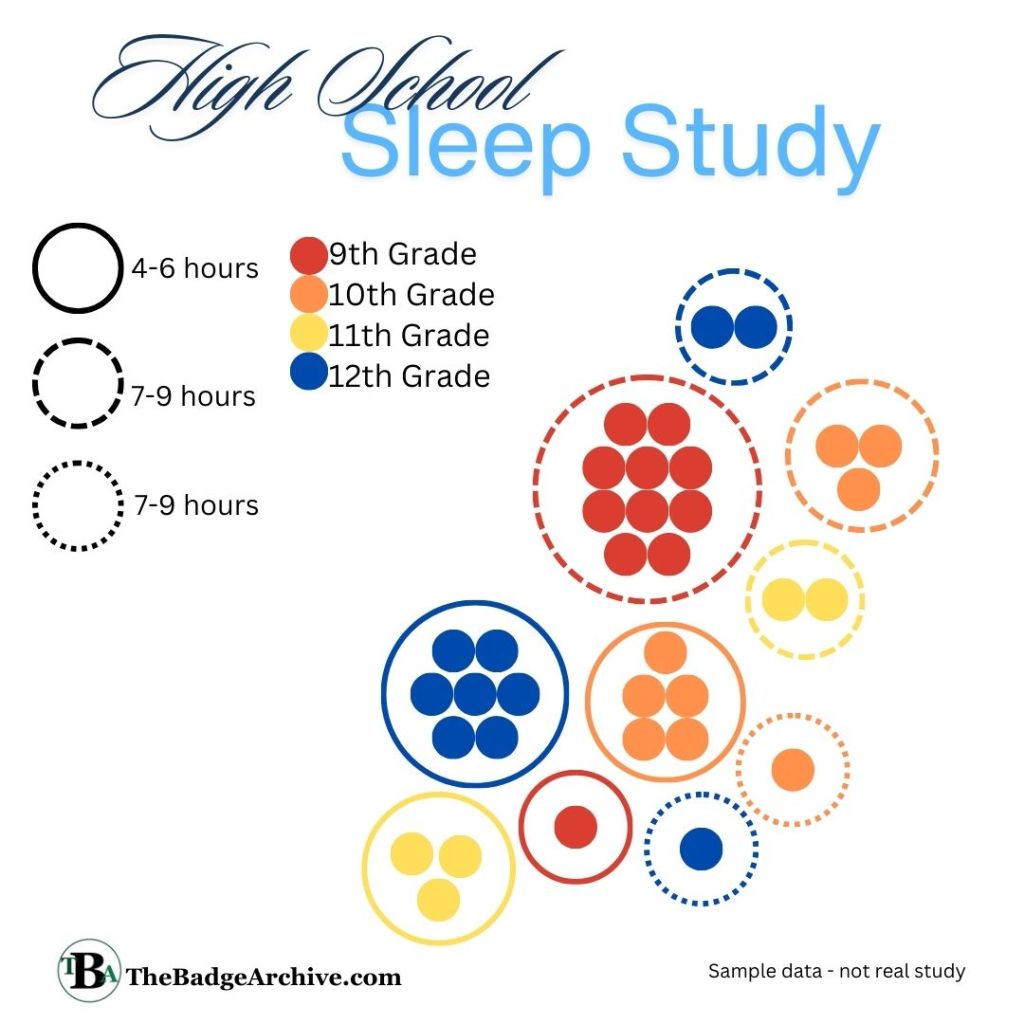
In the Bubble Chart, all we did was move our dots in the Bar Graph into groups and gave an outline circle of them in a style showing what category they belonged to in the Bar Graph. When displayed in this manner, it is very obvious that 9th graders mostly sleep 7-9 hours a night and the 12th graders typical sleep 4-6 hours. 10th graders are more evenly split.
This also makes it clear that our sample size of data was not accurate enough to analyze with both grade level and hours of sleep. The data was lacking. We only asked five 11th grades, nine 10th graders, ten 12th graders, and eleven 9th graders. To have a better study, we should have ensured that each grade level had at least 10 students asked.